

Python für die Datenanalyse: Matplotlib und Datenvisualisierung
Von Yasin TANIŞ

Einführung
Datenvisualisierung bedeutet, komplexe Datensätze mit Grafiken und Diagrammen verständlicher zu machen. Python bietet mehrere Bibliotheken für Datenanalyse und Visualisierung, und Matplotlib gehört zu den beliebtesten. In diesem Beitrag lernen wir die Grundlagen der Datenvisualisierung mit Matplotlib kennen.
Was ist Matplotlib?
Matplotlib ist eine leistungsfähige und flexible Bibliothek für 2D-Diagramme in Python. Damit lassen sich Liniendiagramme, Balkendiagramme, Streudiagramme und viele weitere Diagrammarten erstellen.
Matplotlib installieren
Bevor wir Matplotlib nutzen, müssen wir es installieren. Falls es auf Ihrem System noch nicht installiert ist, installieren Sie es mit diesem Befehl:
pip install matplotlibGrundlegende Verwendung
Beginnen wir mit einem einfachen Liniendiagramm.
import matplotlib.pyplot as plt
# Example data
x = [1, 2, 3, 4, 5]
y = [2, 3, 5, 7, 11]

# Creating a line plot
plt.plot(x, y)
plt.xlabel('X Axis')
plt.ylabel('Y Axis')
plt.title('Simple Line Plot')
plt.show()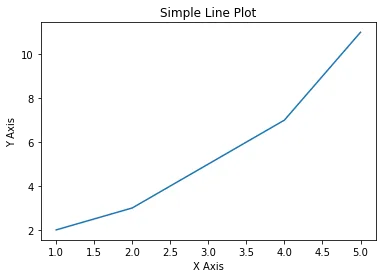
Dieses einfache Beispiel zeigt, wie man mit Matplotlib ein Liniendiagramm zeichnet. Sehen wir uns nun weitere Diagrammarten und Anpassungen an.
Diagrammarten
Balkendiagramme
Balkendiagramme dienen zur Darstellung kategorialer Daten.
import matplotlib.pyplot as plt

# Example data
categories = ['A', 'B', 'C', 'D', 'E']
values = [4, 7, 1, 8, 5]
# Creating a bar chart
plt.bar(categories, values)
plt.xlabel('Categories')
plt.ylabel('Values')
plt.title('Simple Bar Chart')
plt.show()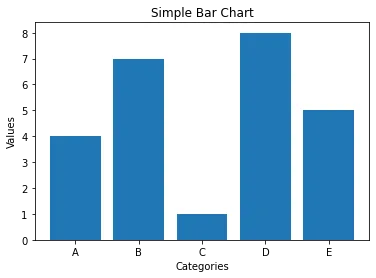
Streudiagramme
Streudiagramme zeigen den Zusammenhang zwischen zwei Variablen.
import matplotlib.pyplot as plt

# Example data
x = [5, 7, 8, 7, 2, 17, 2, 9, 4, 11]
y = [99, 86, 87, 88, 100, 86, 103, 87, 94, 78]
# Creating a scatter plot
plt.scatter(x, y)
plt.xlabel('X Variable')
plt.ylabel('Y Variable')
plt.title('Simple Scatter Plot')
plt.show()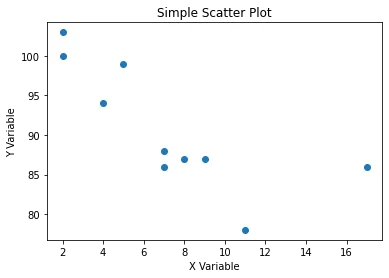
Histogramme
Histogramme zeigen, wie Daten verteilt sind.
import matplotlib.pyplot as plt

# Example data
data = [1, 2, 2, 3, 3, 3, 4, 4, 4, 4, 5, 5, 5, 5, 5]
# Creating a histogram
plt.hist(data, bins=5)
plt.xlabel('Values')
plt.ylabel('Frequency')
plt.title('Simple Histogram')
plt.show()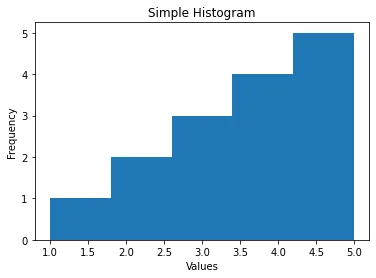
Kreisdiagramme
Kreisdiagramme zeigen die Anteile kategorialer Daten.
import matplotlib.pyplot as plt
# Example data
labels = ['A', 'B', 'C', 'D']
sizes = [15, 30, 45, 10]
# Creating a pie chart
plt.pie(sizes, labels=labels, autopct='%1.1f%%', startangle=90)
plt.axis('equal')  # Equal aspect ratio ensures that pie is drawn as a circle.
plt.title('Simple Pie Chart')
plt.show()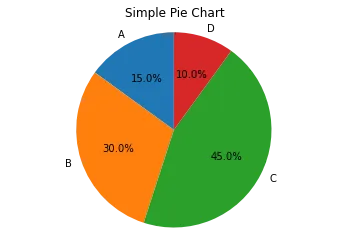
Diagramme anpassen
Matplotlib erlaubt umfangreiche Anpassungen, damit Diagramme besser lesbar und ansprechender werden.
Farben und Stile
Mit Farben und Stilen können Sie Ihre Diagramme ansprechender gestalten.
import matplotlib.pyplot as plt

# Example data
x = [1, 2, 3, 4, 5]
y = [2, 3, 5, 7, 11]
# Customizing the line plot
plt.plot(x, y, color='red', linestyle='--', marker='o')
plt.xlabel('X Axis')
plt.ylabel('Y Axis')
plt.title('Customized Line Plot')
plt.show()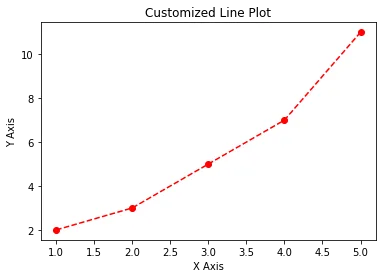
Diagrammgröße und Auflösung
Größe und Auflösung eines Diagramms lassen sich an verschiedene Bedürfnisse anpassen.
import matplotlib.pyplot as plt

# Example data
x = [1, 2, 3, 4, 5]
y = [2, 3, 5, 7, 11]
# Setting plot size and resolution
plt.figure(figsize=(10, 5), dpi=100)
plt.plot(x, y)
plt.xlabel('X Axis')
plt.ylabel('Y Axis')
plt.title('Large and High-Resolution Plot')
plt.show()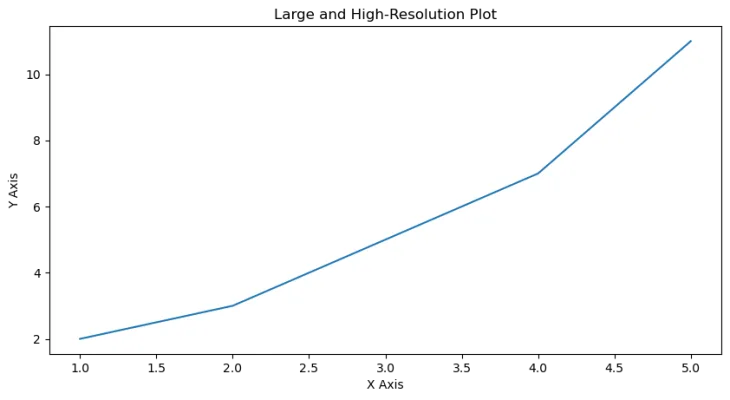
Teildiagramme
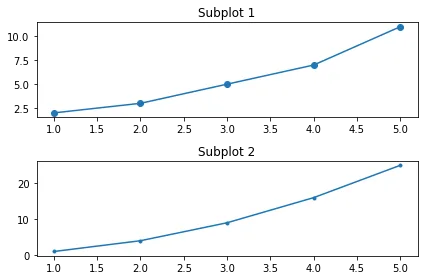
Mit Teildiagrammen (Subplots) zeichnen Sie mehrere Diagramme in einer Abbildung.
Logarithmische Diagramme
Logarithmische Diagramme eignen sich für Daten, die sich über einen sehr großen Wertebereich erstrecken.
import matplotlib.pyplot as plt
import numpy as np

# Example data
x = np.linspace(0.1, 100, 100)
y = np.exp(x)
# Creating a logarithmic plot
plt.plot(x, y)
plt.xscale('log')
plt.yscale('log')
plt.xlabel('Log X Axis')
plt.ylabel('Log Y Axis')
plt.title('Logarithmic Plot')
plt.show()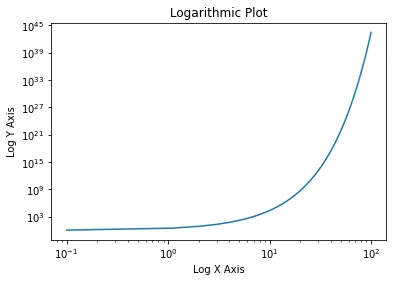
Fortgeschrittene Anpassungen
Anmerkungen
Mit Anmerkungen können Sie bestimmte Punkte hervorheben.
import matplotlib.pyplot as plt

# Example data
x = [1, 2, 3, 4, 5]
y = [2, 3, 5, 7, 11]
# Creating a plot with annotation
plt.plot(x, y)
plt.annotate('Important Point', xy=(3, 5), xytext=(4, 10),
             arrowprops=dict(facecolor='black', shrink=0.05))
plt.xlabel('X Axis')
plt.ylabel('Y Axis')
plt.title('Annotated Plot')
plt.show()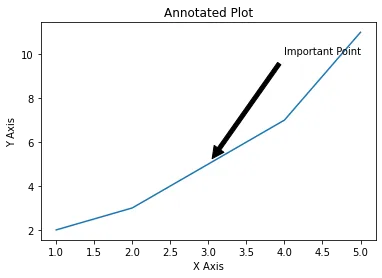
3D-Diagramme
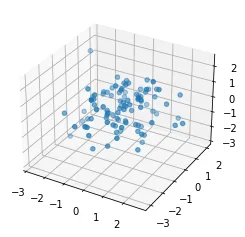
Matplotlib kann auch 3D-Diagramme zeichnen.
from mpl_toolkits.mplot3d import Axes3D
import matplotlib.pyplot as plt
import numpy as np

# Example data
x = np.linspace(-5, 5, 100)
y = np.linspace(-5, 5, 100)
x, y = np.meshgrid(x, y)
z = np.sin(np.sqrt(x**2 + y**2))
# Creating a 3D plot
fig = plt.figure()
ax = fig.add_subplot(111, projection='3d')
ax.plot_surface(x, y, z, cmap='viridis')
plt.title('3D Plot')
plt.show()


fig = plt.figure()
ax = fig.add_subplot(111, projection='3d')
x = np.random.standard_normal(100)
y = np.random.standard_normal(100)
z = np.random.standard_normal(100)
ax.scatter(x, y, z)
plt.show()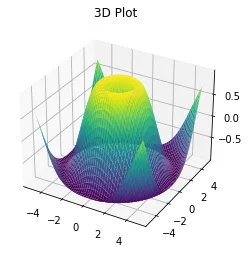
Beispiel mit synthetischen Daten
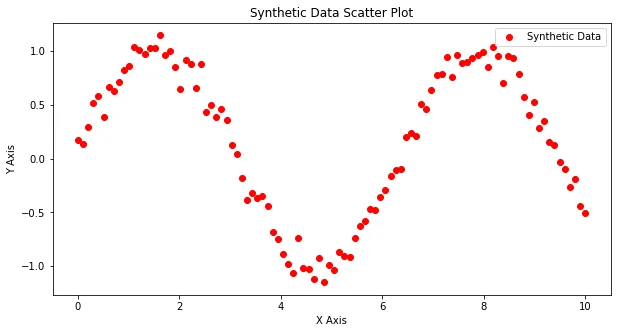
Um Matplotlib in Aktion zu zeigen, erzeugen wir einen synthetischen Datensatz und stellen ihn mit verschiedenen Diagrammarten dar.
import numpy as np
import matplotlib.pyplot as plt

# Generating synthetic data
np.random.seed(0)
x = np.linspace(0, 10, 100)
y = np.sin(x) + np.random.normal(0, 0.1, 100)
# Line plot
plt.figure(figsize=(10, 5))
plt.plot(x, y, label='Synthetic Data')
plt.xlabel('X Axis')
plt.ylabel('Y Axis')
plt.title('Synthetic Data Line Plot')
plt.legend()
plt.show()
# Scatter plot
plt.figure(figsize=(10, 5))
plt.scatter(x, y, label='Synthetic Data', color='red')
plt.xlabel('X Axis')
plt.ylabel('Y Axis')
plt.title('Synthetic Data Scatter Plot')
plt.legend()
plt.show()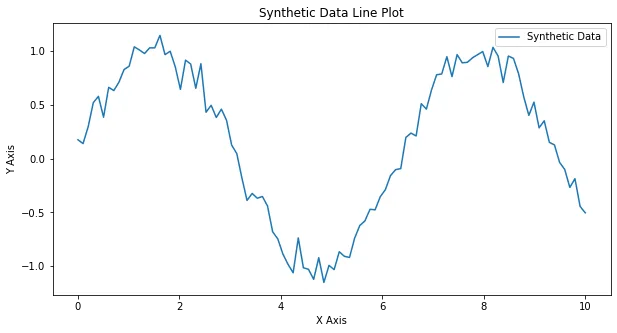
Fazit
Matplotlib ist ein leistungsfähiges und flexibles Werkzeug für die Datenvisualisierung in Python. In diesem Beitrag haben wir Linien-, Balken- und Streudiagramme, Histogramme, Kreisdiagramme und mehr erstellt. Außerdem haben wir Diagramme angepasst und fortgeschrittene Visualisierungen umgesetzt: annotierte Diagramme, Teildiagramme, logarithmische und 3D-Diagramme. Mit dem großen Funktionsumfang von Matplotlib können Sie Ihre Visualisierungskompetenz ausbauen und Ihre Daten klar und überzeugend präsentieren.
Quellen
- Hunter, J. D. (2007). Matplotlib: A 2D Graphics Environment. Computing in Science & Engineering, 9(3), 90–95.
- Matplotlib-Dokumentation: matplotlib.org
- Waskom, M. et al. (2021). Seaborn: Statistical Data Visualization. Journal of Open Source Software, 6(60), 3021. seaborn.pydata.org